Friday, 26 April 2024 01:44 PM
OR
Login using
How trade spats increase poverty: the India-Nepal Episode of 2015
Published On: June 23, 2021 07:55 AM NPT By: Sanjay Kathuria, TG Srinivasan and Swarnim Wagle


Sanjay Kathuria, TG Srinivasan and Swarnim Wagle
Senior Fellow at the Institute of South Asian Studies, Singapore, and Visiting Professor at Georgetown University and Ashoka University. (Twitter: @Sanjay_1818) T.G. Srinivasan is an independent Economics Consultant and former Senior Economist of the World Bank Swarnim Wagle is a former Vice Chair of the National Planning Commission of Nepal. (Twitter: @SwarnimWagle)news@myrepublica.com
More from Author
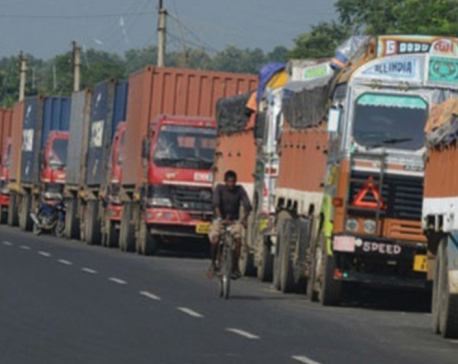
In September 2015, there was a huge trade disruption between Nepal and India that reduced Nepal’s imports from India by 40 percent. Given Nepal’s dependence on imports from India, the decline in trade is likely to have temporarily increased the number of poor people in Nepal by nearly 17 percent, or 1.2 million people. Clustering of people around the poverty line and dependence on net food imports are likely causes for some provinces being more severely affected by the trade disruption. This human-made crisis exacerbated the impact of an earthquake that devastated Nepal in May 2015.
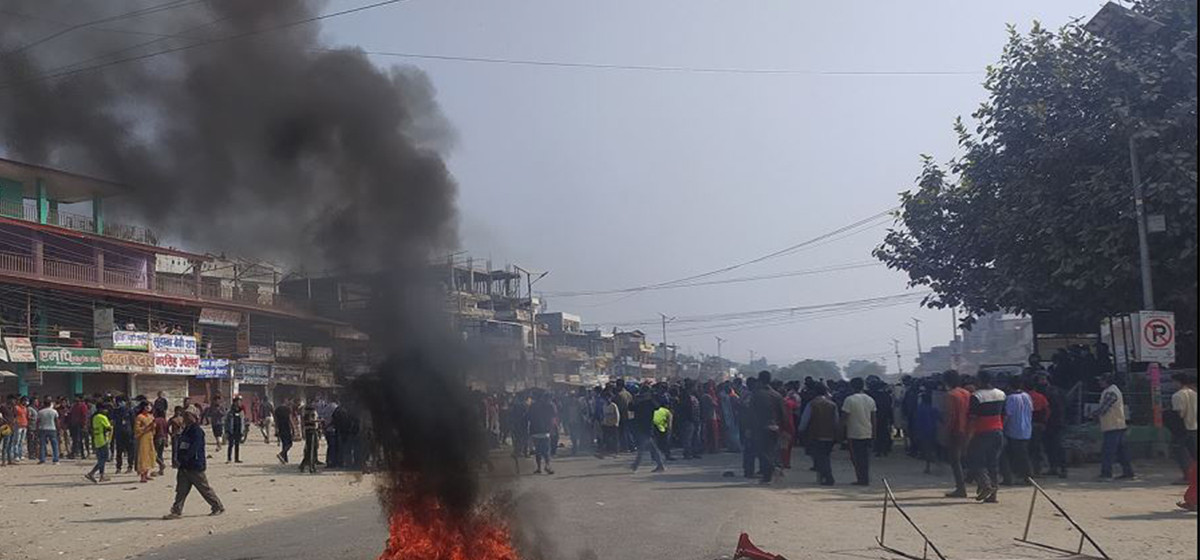
In the aftermath of a devastating earthquake in 2015, Nepal accused India of imposing a crippling trade blockade, restricting supplies of essential food, fuel and medicines. India did not officially acknowledge this to be a blockade, but admitted that trade disruptions had arisen as a result of protests within Nepal by residents in border towns.
Economists know that trade enhances welfare and has played a major role in global poverty reduction. Trade allows access to high quality inputs and modern technology, opens a global market, and encourages improvement in productivity. Consumers understand the gains from trade better than anyone else, because open trade allows consumption of a large variety of goods and services that may not otherwise be available in their own country. If trade is disrupted, the impact on consumers can be immediate and significant. In particular, people living close to international borders stand to lose significantly if cross-border connectivity is obstructed. Since Nepal sources the bulk of its imports from India (over 60 percent in 2015), trade disruption with India has had a significant impact on consumers through inflation and scarcity.
The rupture in trade flows provides a natural experiment to measure its impact on poverty in Nepal. For a period of four and half months in 2015–16 (September 23, 2015 to February 6, 2016), Nepal’s imports from India declined by 40 percent and exports to India declined by nearly as much, compared with the same period in the previous year. Although no quantitative estimates of the poverty impact of the trade disruption are available, international institutions have chronicled the macroeconomic impact. According to the International Monetary Fund’s Article IV 2017 report: “Real GDP growth slowed to 0.6 percent in 2015/16 (mid-July to mid-July). Shortages of fuel and other essential goods drove up inflation to 12 percent (y/y) in January 2016.” Of course, the decline in gross domestic product is also attributable to the earthquake that struck Nepal in April 2015. The World Bank also wrote in May 2016 that “Shortages of goods have pushed up prices … affecting welfare with significant impact on the poor in Nepal, particularly in urban areas.”
In this analysis, we use the change in market prices of consumption goods to estimate the likely impact of the trade spat on poverty in Nepal. Price increases hurt the welfare of all net consumers of goods, while producers with surplus production (marketable surplus) may benefit from price increases. In addition, some prices could decline because the export channel is shut, which leads to an unanticipated increase in domestic supplies. While there are other channels of influence through the labor market (rise in unemployment) and the product market (cut in production of goods and services), which would likely magnify the poverty impact, this article limits itself to the price impact.
Prices and price trends in Nepal follow those in India because of open borders and Nepal’s import dependence on India. Hence, any change in the relative inflation rates (or the inflation “wedge”) between India and Nepal can help identify the price impact of trade disruptions. The price wedge is derived by comparing differences between Nepalese and Indian inflation rates: specifically, the difference between the year-on-year inflation (price increase between, say, January 2015 and January 2016) of the Consumer Price Index for Nepal with that of India for comparable product groups, in the same month.
Just before the trade disruption, in July 2015, the overall inflation wedge between Nepal and India was -0.1 percentage points. This wedge widened to 6 percentage points by January 2016, with oils, fruits, and cereals recording increases exceeding 10 percent, and ghee and oil coming close to 25 percent (Figure 1). By estimating the impact of the change in the price wedge, rather than any other increase in inflation, the resulting poverty numbers can be attributed to the trade disruption. (Note that black market fuel prices surged by some orders of magnitude during the disruption; however, the administered prices reported in official statistics do not reflect this. Hence, our calculations of the poverty impact of price shocks are an underestimate, since they do not capture the effect of the actual rise in fuel prices.)
The price shocks for all consumer goods are applied to each household in the Nepal Living Standards Survey (2010–11), according to the consumer goods’ share in the household’s consumption basket. Price increases diminish the purchasing power of households, while price decreases benefit households if they are net buyers of those items. Households that are net producers (only rice and wheat producers are considered as net producers in our analysis) benefit if the prices of the products they are selling increase. Since the household marketable surplus is not available from the survey, total marketable surplus is calculated from the Food and Agriculture Organization’s food balance for Nepal in 2010, and the gains are distributed pro-rata to all households that are self-sufficient in consumption of the goods in question.
Applied to the Nepal Living Standards Survey (2010–11), trade-disruption-induced price changes are likely to have temporarily increased the percentage of poor people by 16.5 percent, from 25.2 to 29.3 percent of the population; in absolute terms, an additional 1.2 million people were rendered poor. This price increase is associated with a 40 percent reduction in trade between Nepal and its main trading partner, India. Simple arithmetic shows that a mere US$607 in trade (not a handout) lifts one poor Nepali out of poverty. (During the six months of trade disruption with India up to January 2016, Nepal’s imports from India shrunk by US$651 million and exports fell by US$78 million. The sum of imports and exports amounted to US$729 million, using an exchange rate of 100 NPR to US$1. The poverty estimates use Nepal’s national poverty line.)
Figure 1. Price Impacts of Trade Disruption in Nepal, January 2016
(percentage point difference in inflation vs. Indian benchmark)

Note: Inflation is calculated year-on-year
Sources: Computations based on monthly Consumer Price Index series August 2015 to January 2016 from Nepal Rastra Bank’s Macroeconomic Updates and for India from the Reserve Bank of India monthly bulletins: https://www.rbi.org.in/Scripts/BS_ViewBulletin.aspx?Id=19678
Spatial distribution of the adverse effects reflects initial conditions and distance from the trade gateways. Provinces 1, 2 (unnamed, yet) and 6 (Karnali) felt a significantly greater impact than the other provinces (table 1). Clustering of people around the poverty line (reflecting initial conditions) and dependence on net food imports are likely causes of heightened sensitivity of these provinces to trade disruption.
The impact on poverty through price effects is separate from the earthquake-related income shocks in April and May 2015, which was estimated by the World Bank to have pushed an additional 2.5 to 3.5 percent of Nepalis into poverty, meaning an additional 700,000 to 982,000 additional poor, mainly in the rural Central hills and mountains.
The twin shocks of trade and the earthquake, triggered by politics and nature, and channelled through prices and incomes, truly made the fiscal year 2015-2016 disastrous in Nepal, with a recorded growth rate of almost zero percent.
Table 1. Impact of the Trade Shock on Poverty in Nepal: Peripheral Areas Suffered More
(percentage of population living in poverty)
 Source: Simulations using household-level data from the Nepal Living Standards Survey (2010–11).
Mapping of primary sampling units of NLSS to provinces was kindly arranged by Mr. U. Malla, former
Chairman of the Central Bureau of Statistics, Nepal.
Note: Province names have been decided for five of the seven provinces at the time of writing.
----
Sanjay Kathuria is Senior Visiting Fellow at the Centre for Policy Research, India; Non-Resident Senior Fellow at the Institute of South Asian Studies, Singapore, and Visiting Professor at Georgetown University and Ashoka University. (Twitter: @Sanjay_1818)
T.G. Srinivasan is an independent Economics Consultant and former Senior Economist of the World Bank
Swarnim Wagle is a former Vice Chair of the National Planning Commission of Nepal. (Twitter: @SwarnimWagle)
You May Like This

Nepal online trade: Decorating Nepal
Nepal Online Trade is a business initiative of Sajak Yonjan that sells décor materials imported from China, Hong Kong, and... Read More...
Nepal enjoyed trade surplus with 21 countries out of 116 trading partner countries in first two months of current FY
KATHMANDU, Oct 9: Nepal enjoyed a trade surplus with 21 countries in the first two months of the current fiscal year. Read More...
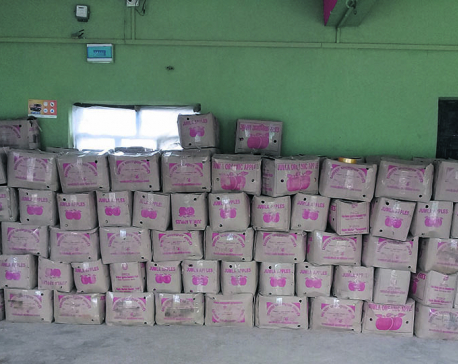
300 tons of Chinese apples entering Nepal every day for Tihar
SINDHUPALCHOWK, Oct 27: Traders are importing some 300 tons of apples every day from China via Tatopani border over the past... Read More...

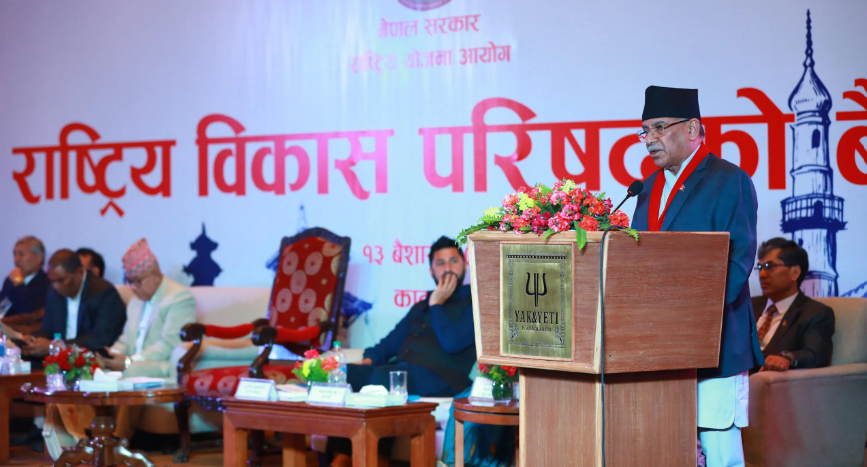

PM Dahal arrives in Morang
13 minutes ago

DDC pays Rs 480 million dues to farmers
24 minutes ago


Gold price increases by Rs 1,400 today
1 hour ago

JSP Central Executive Committee meeting today
2 hours ago
Just In
- MoFAGA transfers 8 under secretaries and 11 section officers (with list)
- PM Dahal arrives in Morang
- DDC pays Rs 480 million dues to farmers
- Police arrest seven Indian nationals with 1.5 kg gold and Rs 14.3 million cash
- Gold price increases by Rs 1,400 today
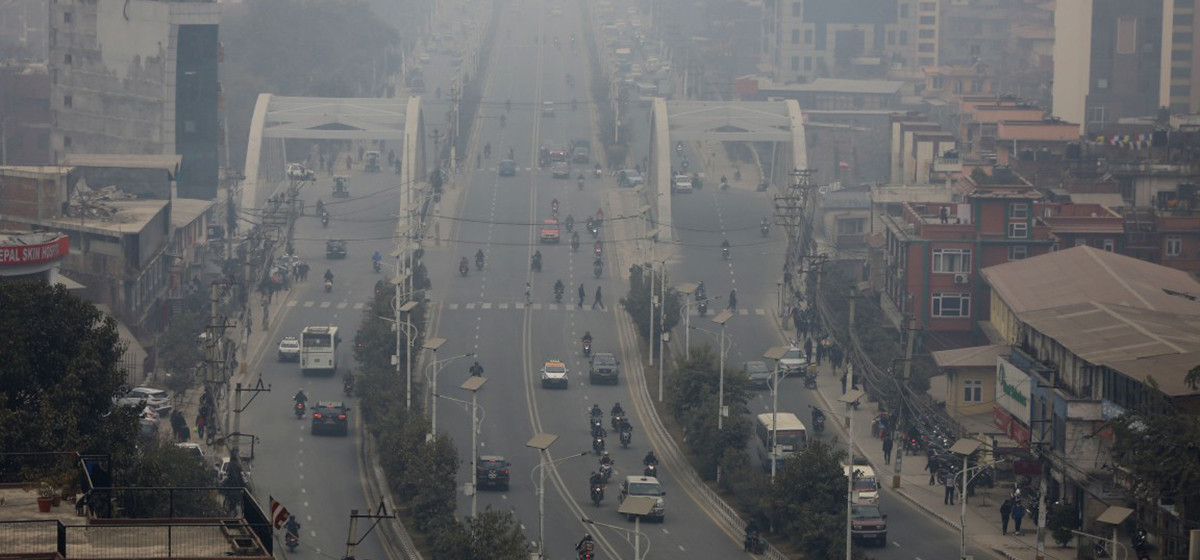
- Kathmandu continues to top the chart of world’s most polluted city
- JSP Central Executive Committee meeting today
- Ambassador Adhikari presents his letter of credentials to Turkish President Erdoğan
Leave A Comment