Saturday, 27 July 2024 08:39 AM
OR
Login using
Opinion
Nepal’s tryst with Corruption Perceptions
Published On: February 1, 2024 09:00 AM NPT By: Narayan Manandhar

Marking 20 Years of CPI data
The publication of Corruption Perceptions Index (CPI) 2023 marks 20 years of Nepal’s enlistment in global league of corruption perceptions index. Transparency International (TI) started publishing CPI from 1995 onwards, but Nepal got enlisted only from 2004. This is because there were not enough surveys organized for Nepal. Now, we have 20 years of CPI data (2004-2023) for study and comparison and see how we have fared or unfared in fighting corruption. Having a 20-year track record is much better than a year-to-year comparison as there are no quick fix, silver-bullet solutions to corruption problem. Fighting corruption can be a long drawn process and consuming ages.
Since its publication in 1995, there have been considerable changes in CPI data in terms of country coverage, data sources and methodology employed. CPI is a single but simplified measure of a highly complex concept called corruption. Corruption can mean different things to different people. It is extremely difficult to capture all the forms of corruption into a single index or a score. Obviously, there are pitfalls and criticisms. One such criticism was non-comparability of CPI data from one year to the other. However, TI corrected this problem from 2012 onwards using consistent data sources. Prior to 2012, CPI scores were presented as a snap-shot picture of country level corruption. In the absence of comparison, it is too difficult to measure trends - successes as well as failures - in fighting corruption.
From 2012 onwards, CPI scores are computed, using consistent data sources and re-scaled from original decile (0-10) to percentile (0-100) scales. In a way, 2012 provides baseline data for comparison.
With this line of reasoning, we have two sets of CPI data for Nepal. One set of CPI data includes non-comparable CPI scores from 2004-2011 and the second set of comparable data from 2012-2023. The Table 1 presents CPI scores for Nepal including global ranking, standard error, 90% confidence interval and number of data sources. Similarly, Chart 1 presents Nepal’s CPI data after 2012 with a simple trend line.
|
Table 1: CPI Scores for Nepal from 2004-2023 |
|||||||
|
Year |
CPI Score |
Global Ranking |
Total Nr of Countries |
Standard Error |
90% Confidence Interval |
Nr of data Sources |
|
|
Low |
High |
||||||
|
Set 1: Non-comparable CPI scores from 0-10 |
|||||||
|
2004 |
2.8 |
90 |
146 |
1.1 |
1.6 |
3.4 |
3 |
|
2005 |
2.5 |
117 |
159 |
0.7 |
1.9 |
3 |
4 |
|
2006 |
2.5 |
121 |
163 |
0.4 |
2.3 |
2.9 |
5 |
|
2007 |
2.5 |
131 |
180 |
0.3 |
2.3 |
2.7 |
7 |
|
2008 |
2.7 |
121 |
180 |
0,5 |
2.4 |
3 |
6 |
|
2009 |
2.3 |
143 |
180 |
NA |
2 |
2.6 |
6 |
|
2010 |
2.2 |
154 |
179 |
NA |
1.9 |
2.5 |
6 |
|
2011 |
2.2 |
154 |
183 |
0.1 |
2.1 |
2.4 |
6 |
|
Set 2: Comparable CPI scores from 0-100 |
|||||||
|
2012 |
27 |
139 |
176 |
2.4 |
23 |
31 |
5 |
|
2013 |
31 |
116 |
177 |
1.4 |
29 |
33 |
5 |
|
2014 |
29 |
126 |
175 |
2.2 |
22 |
35 |
5 |
|
2015 |
27 |
130 |
168 |
2.73 |
22 |
35 |
5 |
|
2016 |
29 |
131 |
176 |
2.33 |
25 |
33 |
6 |
|
2017 |
31 |
122 |
180 |
2 |
28 |
34 |
6 |
|
2018 |
31 |
124 |
180 |
1.85 |
28 |
34 |
6 |
|
2019 |
34 |
113 |
180 |
1.76 |
31.11 |
36.89 |
6 |
|
2020 |
33 |
117 |
180 |
1.35 |
30.78 |
35.22 |
6 |
|
2021 |
33 |
117 |
180 |
0.54 |
32.12 |
33.88 |
6 |
|
2022 |
34 |
110 |
180 |
0.93 |
32 |
36 |
6 |
|
2023 |
35 |
108 |
180 |
0.74 |
34 |
36 |
6 |
What is CPI?
Before delving into the data, it is worth understanding CPI and its possible implications. CPI is an aggregated measure of corruption perception. It is also called “poll of the polls” because TI does not conduct any surveys on its own. What it does is collect survey results organized by some other institutions (data sources) and use statistical techniques to assign a single score ranging from 0-100. Lower scores imply more corruption perception and vice versa. In order to avoid bias in constructing CPI, there must be a minimum of three surveys available and each survey should cover at least 15 countries.
Conceptually speaking, CPI is the perception of the level of corruption in the public sector in a country. Such perceptions are of foreign experts and the business community having experience dealing in multiple countries. TI publishes another set of data called Global Corruption Barometer that incorporates perception of the general populace. Similar to weather forecasting, GCB survey data presents whether corruption is increasing or decreasing, sectors are more prone to corruption and effectiveness of state actions to fight corruption.
One major weakness of CPI data is that it is a measure of perceptions of corruption rather than reality; perceptions are subjective and they can vary from one person to the other even in a single context. By definition, corruption is a secret transaction therefore it is near impossible to measure the reality of corruption. Hence perception matters.
Albeit subjective, at a global level, CPI is one of the most popular measures of corruption. In fact, it has become a brand name - a flagship of Transparency International. Though many criticisms were labeled against CPI, during initial stages of the global anti-corruption movement, it provided an immense power to generate public awareness, draw media attention and initiate anti-corruption advocacy campaigns. With the invention of new tools to measure various forms of corruption, CPI is gradually losing its charm. Like UNCAC – another powerful tool to set international norms and standards in fighting corruption, CPI is still a powerful tool. Plethora of corruption measures are now available to capture different forms of corruption. And such measures can be direct or indirect, subjective or objective, related to measuring risks or constraints of corruption, state’s capacity and response to fight corruption - de facto and de jure.
What does the data say for Nepal?
In the first set of non-comparable CPI data what we see is that except 2007, there is a constant fall in CPI data and ranking from 2004 to 2011. The CPI data for Nepal is not only at the rock-bottom, its constant fall does indicate a worsening situation of corruption perception. This is also evidenced by diminution in standard errors and narrowing down of confidence intervals. Smaller standard errors and narrowing down of confidence intervals indicates consistency and reliability of data. Remember, this period is chequered by political agitations and transition. King Gyanendra’s takeover, establishment of an unconstitutional anti-graft body like RCCC, people’s movement, CA elections and, obviously, the notorious Sudan Scandal are some of the significant events of this period.
Hare and Tortoise
The second set of CPI data (2012-23), expected to be comparable, also presents literally no or marginal improvements. The data is also presented in a chart for visual comparison.
Although there are marginal changes in yearly data, the country secured CPI scores of 27 in 2012 and 35 in 2023. TI has designated this eight point increase during twelve years to be significant, that is, the changes in CPI scores are not due to random errors. With this pace of increase Nepal’s anti-corruption drive can be related as a race between a tortoise and a rabbit. Obviously, the rabbit represents the spiraling of corruption while the tortoise represents our anti-corruption campaign.
You May Like This
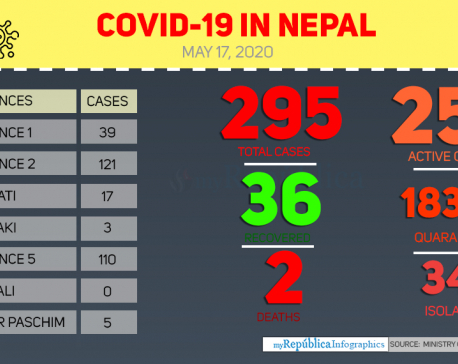
Health ministry confirms three new COVID-19 cases, number of total cases reaches 295
KATHMANDU, May 17: Nepal reported three new cases of COVID-19 on Sunday evening, taking the national tally to 295. ... Read More...
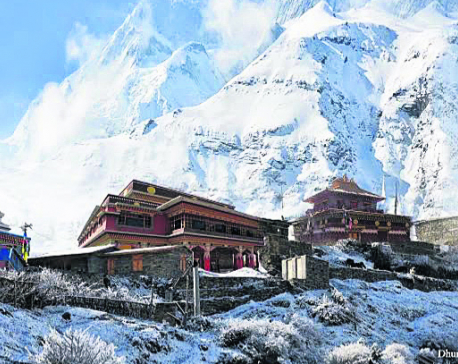
Dhurmus, Suntali to build ‘a Nepal within Nepal’
KATHMANDU, June 5: After successfully completing three settlement projects for earthquake victims and other communities, the actor couple Sitaram Kattel (Dhurmus)... Read More...
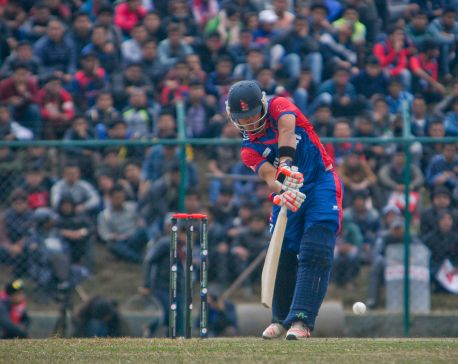
Nepal vs Kenya: Five crucial things Nepal looks for second match
KATHMANDU, March 12: Nepal is taking on Kenya on Monday in the second match of the ICC World Cricket League... Read More...

Ensuring Food Safety Amidst Challenges
23 hours ago


NRB unveils monetary policy
19 hours ago


NRB set to issue monetary policy today
21 hours ago


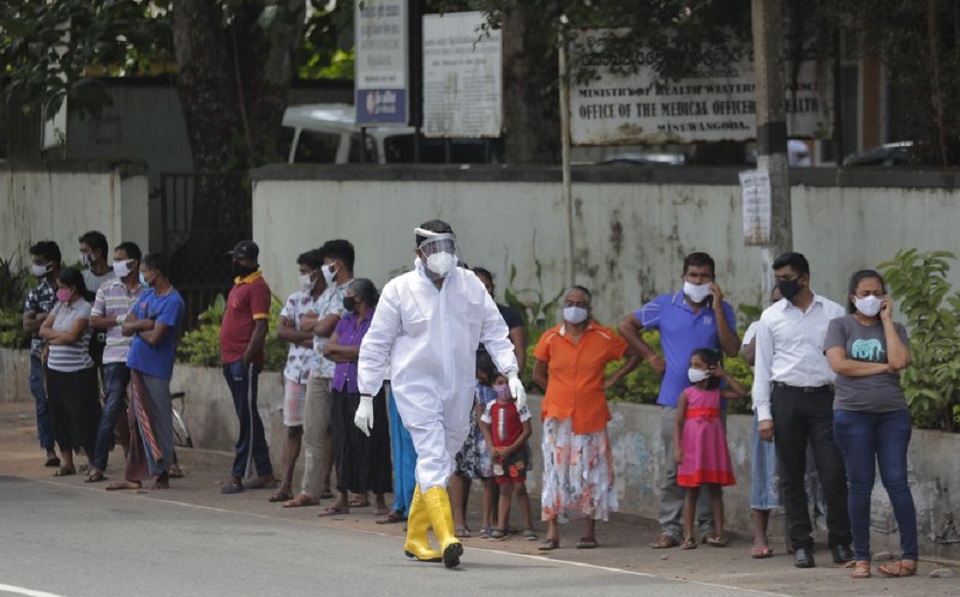
Forced Covid-19 cremations: is it too late for redemption?
54 minutes ago
NEB to publish Grade 12 results next week
11 hours ago
NC defers its plan to join Koshi govt
12 hours ago

NRB to review microfinance loan interest rate
13 hours ago

Just In
- NRB introduces cautiously flexible measures to address ongoing slowdown in various economic sectors
- Forced Covid-19 cremations: is it too late for redemption?
- NRB to provide collateral-free loans to foreign employment seekers
- NEB to publish Grade 12 results next week
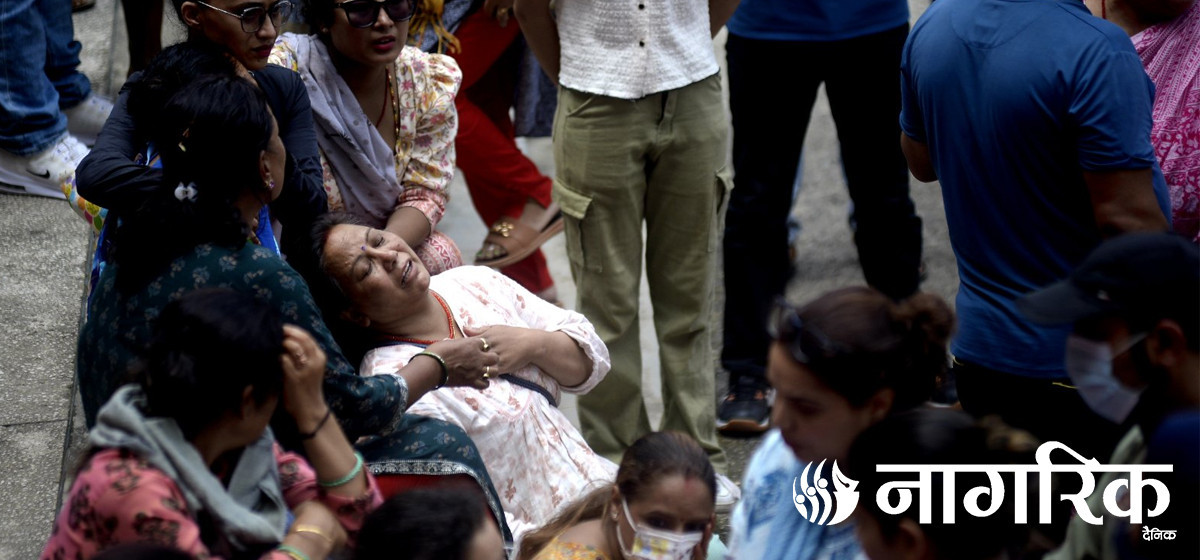
- Body handover begins; Relatives remain dissatisfied with insurance, compensation amount
- NC defers its plan to join Koshi govt
- NRB to review microfinance loan interest rate
- 134 dead in floods and landslides since onset of monsoon this year
Leave A Comment