Friday, 19 April 2024 11:15 AM
OR
Login using

Both bribe payers and bribe takers gain through corrupt transactions, but the cost is passed on to the poor, honest and disfranchised population
With the rise of “populism” and populist governments in the world, corruption has been considered as both its cause and the consequence. Whether it is 1Malaysia Development Berhard (1MDB) in Malaysia, Operation Car Wash in Brazil or the case of Samsung in South Korea, corruption is the key factor in political changes. Even US President Donald Trump’s campaign for Draining the Swamp (DTS) and Indian Prime Minister Narendra Modi’s demonetization program are related with corruption problems. When corruption is deeply entrenched in politics, it is difficult to discern whether it is a problem or a solution.
Controlling corruption is easier said than done. Experiences show that there are not more than a dozen countries having a successful track-record of controlling scourge of corruption. There are theories identifying corruption problem as a social norm rather than an aberration in individual behavior. It could take place because of individual’s need or greed, but a person’s disposition toward corruption is also determined by prevalent social norm—that is what one expects others to behave in a similar situation.
For an individual, it will be too costly to behave like a saint when everyone indulges in cheating. This essentially puts us in a dilemma. Due to prevalent norms of corruption, otherwise an honest public servant is pushed to accept bribes. In a corrupt environment, even the honest public servant is forced to assume that ‘nobody will believe in my honesty even if I refrain from taking bribes.’ Or the person might rationalize it by thinking ‘if I don’t take bribes, someone else will do so anyway.’ This applies to an honest businessperson too: ‘No one is going to believe that I secured contracts without paying bribes.’ Or one might be tempted to believe that if s/he does not pay bribes to public officials others will secure the contract by paying bribes. The resultant behavior from this prisoner’s dilemma like situation is the public officials and the business people compete to secure more bribes. In a distrusting environment, corruption is reduced to a collective action problem. Individually, both bribe payers and bribe takers gain through corrupt transactions, but the cost is passed on to the poor, honest and disfranchised population.
Corruption matrix
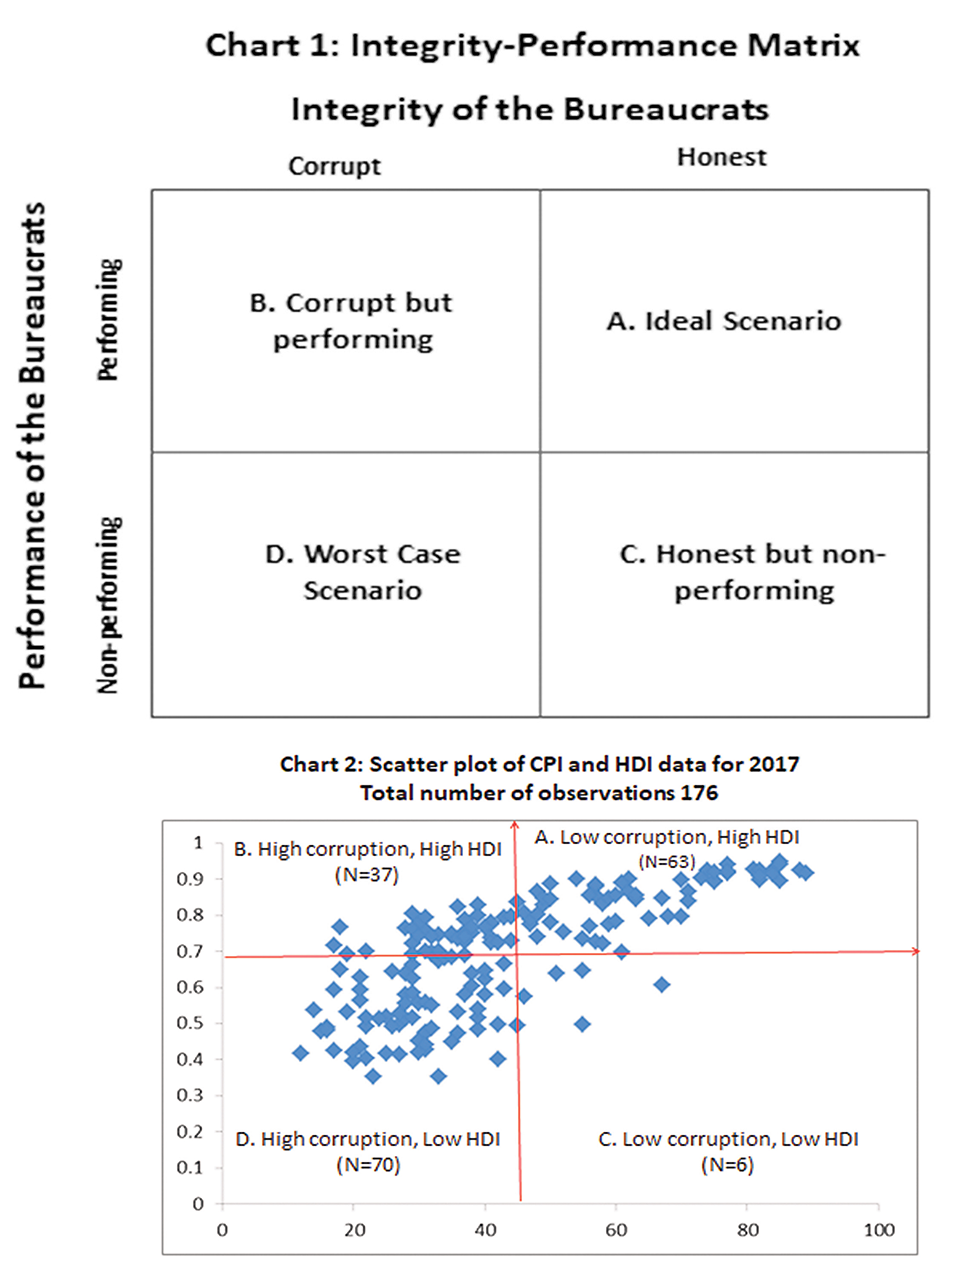
A couple of decades back, while discussing contemporary development issues in Nepal, a friend of mine postulated that in an underdeveloped country like ours it is better to have corrupt, but performing leaders or bureaucrats than to have an honest but non-performing ones. This reinforces the argument that corruption greases the squeaky wheels. It has deeper consequences. With performing and non-performing bureaucrats on one hand, and, corrupt and honest bureaucrats, on the other, we can have four behavioral typologies as depicted in chart 1.
In the matrix, situation A (ideal situation) is better than situation D (worst situation). We do not find problem in making a choice between situations A and D. But situations B and C pose a dilemma. In situation C, we have bureaucrats who are honest, but do not deliver results. In situation B we have corrupt bureaucrats, but they do deliver results.
We are put in an uncomfortable situation of making a choice between honesty and results. Honest leaders and bureaucrats are not performing and performing leaders and bureaucrats are not honest. The situation may be compared to what the political scientist Prof Samuel P Huntington wrote in 1968: “In terms of economic growth, the only thing worse than a society with a rigid, over-centralized, dishonest bureaucracy is one with a rigid, over-centralized and honest bureaucracy.”
If we are given the choice between situation B (corrupt but performing) and C (honest but non-performing), what should we do? Probably, we need to look into empirical data (see chart 2).
Data speak
Corruption Perception Index (CPI) and Human Development Index (HDI) data for 2017 are available for 176 countries. Assuming that CPI measures a degree of country’s corruption perception and HDI measures the performance of the leaders and bureaucrats, data for 176 countries are scatter plotted under two dimensions—CPI and HDI (see chart 2). The two red lines, running through horizontal and vertical axis are drawn to divide the graph into four quadrants. These lines are drawn from the points of simple average values of CPI 2017 (43.3) and HDI 2017 (0.696). This is done with a caveat that CPI and HDI scores may not be amenable to simple averages. The countries falling right side of X axis (above average) can be regarded as relatively clean countries, and countries on the left (below average) as relatively corrupt countries. Same goes with horizontal line or y axis—countries at the top of the threshold (above average) are relatively developed countries and below the threshold (below average) are relatively poor countries. The number of observations (N) found in each cell is also given in chart 2.
There are a total of 63 countries in the cell representing an ideal scenario (honest and performing). In the worst case scenario (corrupt and non-performing) there are 70 countries. Though the total number of countries in these two cells (A and D) is almost close (63 vs 70), one can observe a distinct pattern in the distribution of scatter plots.
In an ideal scenario (cell A) the countries are distributed somehow in a linear pattern—moving from bottom left to top right. And in the worst case scenario (cell D), the countries are concentrated at the top right corner of the cell.
There is a marked difference in distribution of countries between cells B and C. In situation B (corrupt but performing) we have a total of 37 countries while in situation C (honest but non-performing), in spite of large size of the cell, there are just six countries—Bhutan, Rwanda, Cabo Verde, Namibia, Sao Tome and Principe and Senegal. It seems it is rare to find honest (less corrupt) but at the same time underdeveloped countries.
Against the argument of chart 1, distribution of CPI and HDI data in chart 2 reveals that pragmatism (corrupt but performing) seems to have prevailed over a saint like behavior (honest but non-performing). However, the chart also reveals a worrisome picture. There is a greater number of countries in the worst-case scenario (corrupt and non-performing) vis-à-vis best-case scenario (honest and performing). But the difference is marginal.
You May Like This
Corruption runs deep and wide
Corruption is no more only a case where one takes money straight away from the service seekers. It has taken... Read More...
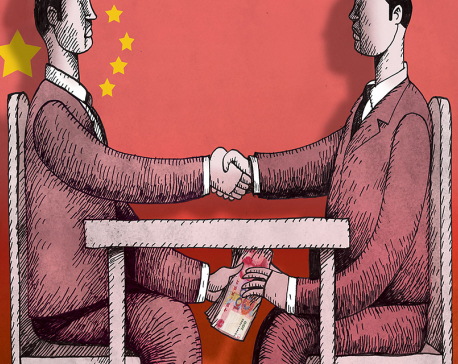
China’s war on corruption
Recognizing the potential of corruption to undermine the legitimacy of Communist Party, Xi has embarked on an anti-graft campaign that... Read More...

If we’re to truly beat corruption, we need to instil a culture of lawfulness today
Each year, on December 9, the world marks International Anti-Corruption Day. We treat this not only as a means to... Read More...


ACC Premier Cup semi-final: Nepal vs UAE
10 minutes ago


Taylor Swift releases ‘The Tortured Poets Department’
59 minutes ago

Just In
- Gold items weighing over 1 kg found in Air India aircraft at TIA
- ACC Premier Cup semi-final: Nepal vs UAE
- Sindhupalchowk bus accident update: The dead identified, injured undergoing treatment
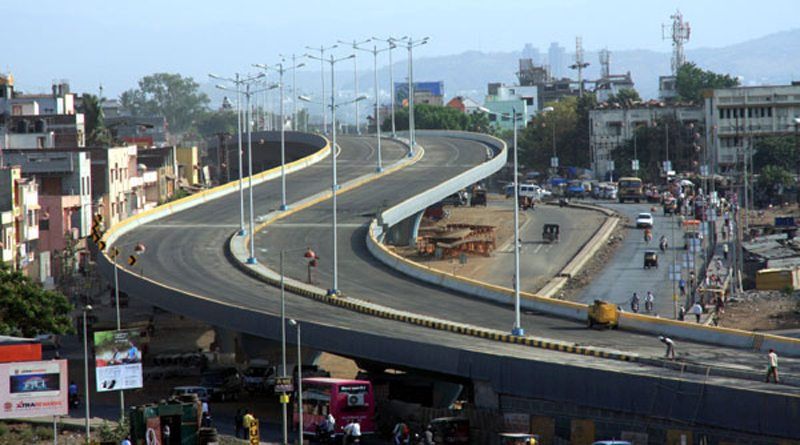
- Construction of bailey bridge over Bheri river along Bheri corridor reaches final stage
- Taylor Swift releases ‘The Tortured Poets Department’
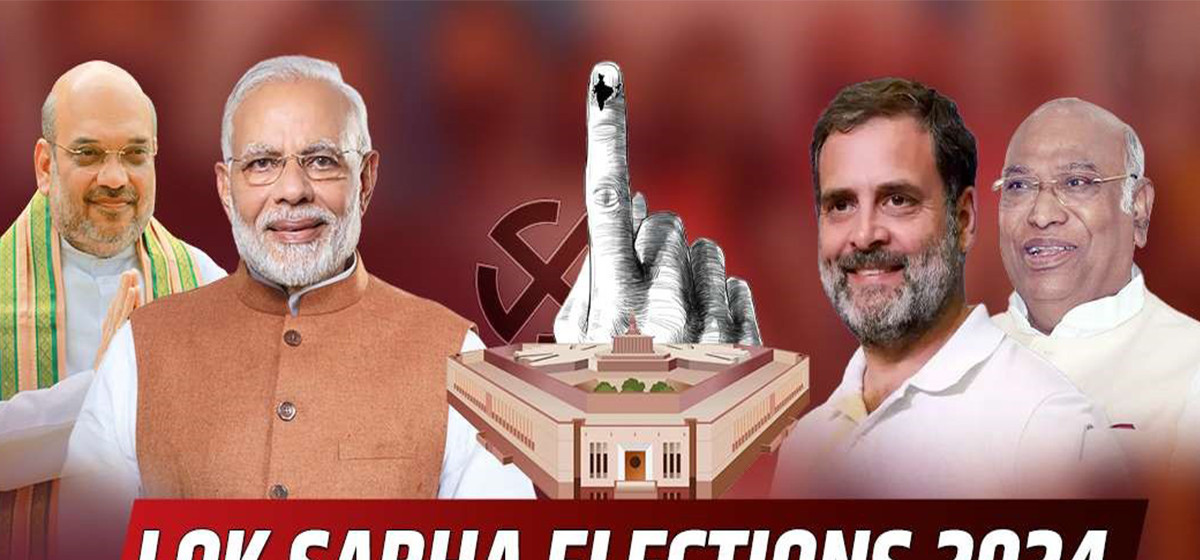
- India starts voting in the world’s largest election as Modi seeks a third term as prime minister
- EC seeks cooperation for free and fair by-election
- Bus carrying wedding procession attendees meets with accident in Sindhupalchowk; three killed
Leave A Comment