Friday, 26 April 2024 04:43 AM
OR
Login using
Poverty under multi-dimensional index halved in 8 yrs
Published On: December 21, 2017 08:15 AM NPT By: Rudra Pangeni | @rudrapang

286 persons out of 1,000 are poor as per multi-dimensional indicators
KATHMANDU, Dec 21: The multi-dimensional poverty index, which counts deprivation under indicators including sanitation, drinking water, education and health, has halved in 8 years, according to the latest Multidimensional Poverty Index (MPI) report released by the National Planning Commission on Wednesday.
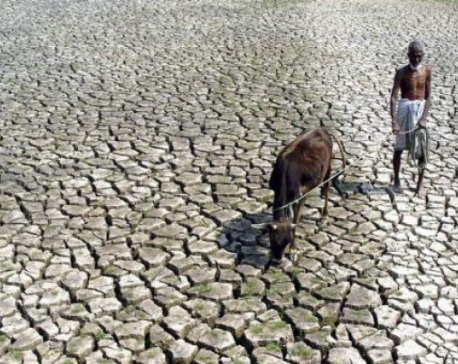
Over 7.9 million people, or 28.6 percent of the total population, are living in multidimensional poverty, according to the report based on the 2014 Indicator Cluster Survey of 12,000 households, or approximately 54,300 people. This means 286 people out of every 1,000 are multidimensionally poor. A total of 59 percent of the population was poor under multidimensional indicators in 2006. The percentage came down to 39 percent in 2011.
This calibration of deprivation under 10 indicators--2 for health, 2 for education and 6 for living standard-- is quite different from traditional poverty computations based on monetary measures. For the multidimensional index, health, education and living standard have equal weightage. Under monetary measures, 22 percent of the population is now living below the poverty level.
Seven percent of the urban and 33 percent of the rural population are multidimensionally poor. "Provinces 2 and 6 have the highest rates of multidimensional poverty, with every second person multidimensionally poor, followed by Province 5 and 7 (approximately 30 percent)," says the report. Provinces 3, 4 and 1 have 12, 14 and 20 percent multidimensional poverty respectively.
In a comparison between Provinces 2 and 6, Province 2 has more children out of school, low school attendance and lack of improved sanitation while Province 6 has lower assets ownership and higher child mortality.
A disheartening find is that 41.6 percent in the 0- 9 years age group are living in multidimensional poverty.
The 10 deprivation indicators used in the survey include undernourished shown by underweight for age, death of a child in the last five-year period, no family members aged 10 or older completing 5 years of schooling, and any school-aged child not attending school. The other deprivations are measured on six indictors: cooking with dung, wood or charcoal; no improved sanitation or improved but shared with others; no improved drinking water or safe drinking water a minimum 30 minutes walk from home; no electricity; dirt, sand, dung floor or roof of thatch/palm leaf, sod, rustic mat, wood planks; not owning more than one of these --radio, TV, telephone , bicycle, motorbike, or refrigerator-- as well as not owning a car or truck.
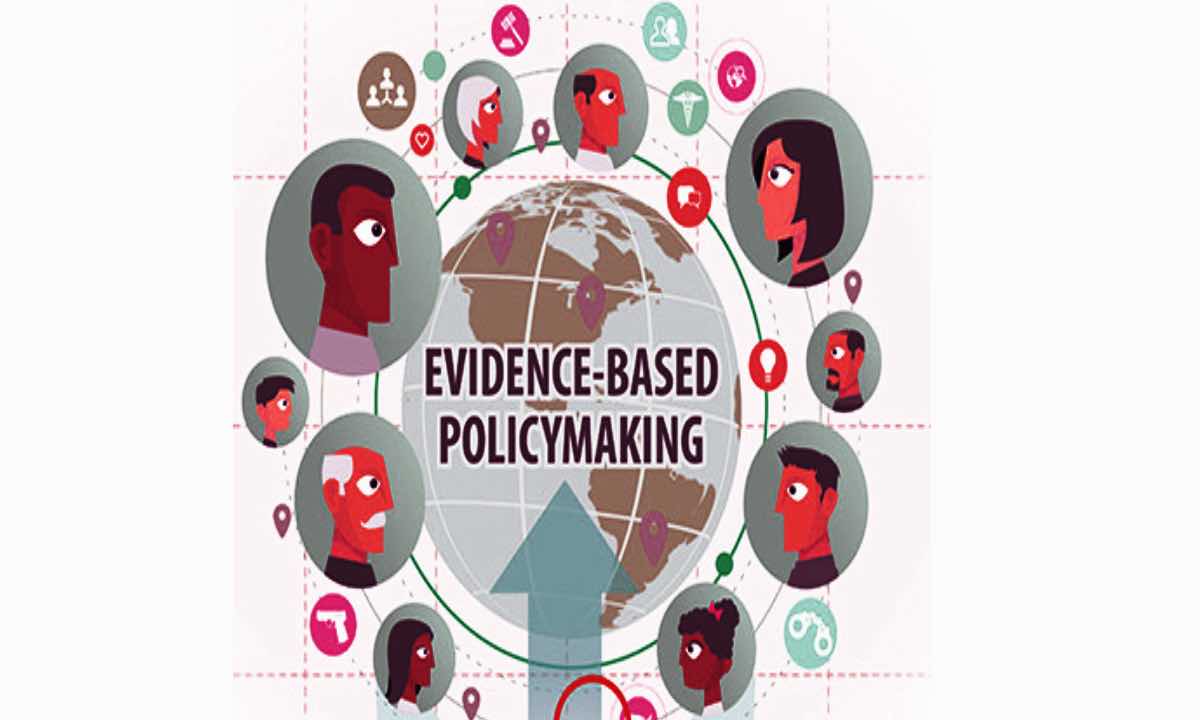
Speaking at the report launch function, Vice-chairman of the National Planning Commission Swarnim Wagle said these indicators, which are based particularly on the new provincial units, are helpful for more rational resource allocation and distribution.
Sabina Alkire, director of Oxford Poverty and Human Initiative (OPHI) , said the scale of national poverty reduction was 'both dramatic and encouraging'. She said, "The poverty level can easily be reduced to single digit by 2030 even with just business as usual." NPC worked together with OPHI to do the survey and analyze the data.
"This more scientific method of measuring poverty level in the province level has provided new data which can be useful for the proper allocation of resources," added Wagle noting that they had faced a real problem while formulating the budget for this year without any data om the local units and provinces.
"Major investments in health and education will be necessary to lift the poorest of the poor out of multidimensional poverty. Further, in order to reduce regional inequalities across provinces, greater interventions for the poorest provinces are required," says the report.
You May Like This
UN expert: Millions face dire poverty from climate change
BERLIN, June 26: A United Nations expert on poverty says hundreds of millions of people around the world face hunger,... Read More...

Over 391 thousand people below poverty line in Nepal: Govt
KATHMANDU, Oct 17: A total of 391 thousand 831 people are under the poverty line in Nepal, shows a report... Read More...
Nepse index soars by 16 points
KATHMANDU, Oct 3: The stock market witnessed the transactions of worth Rs around 800 million alone on Monday, the second... Read More...


First meeting of Nepal-China aid projects concludes
15 hours ago


Karnali CM Kandel secures vote of confidence
11 hours ago
Just In
- World Malaria Day: Foreign returnees more susceptible to the vector-borne disease
- MoEST seeks EC’s help in identifying teachers linked to political parties
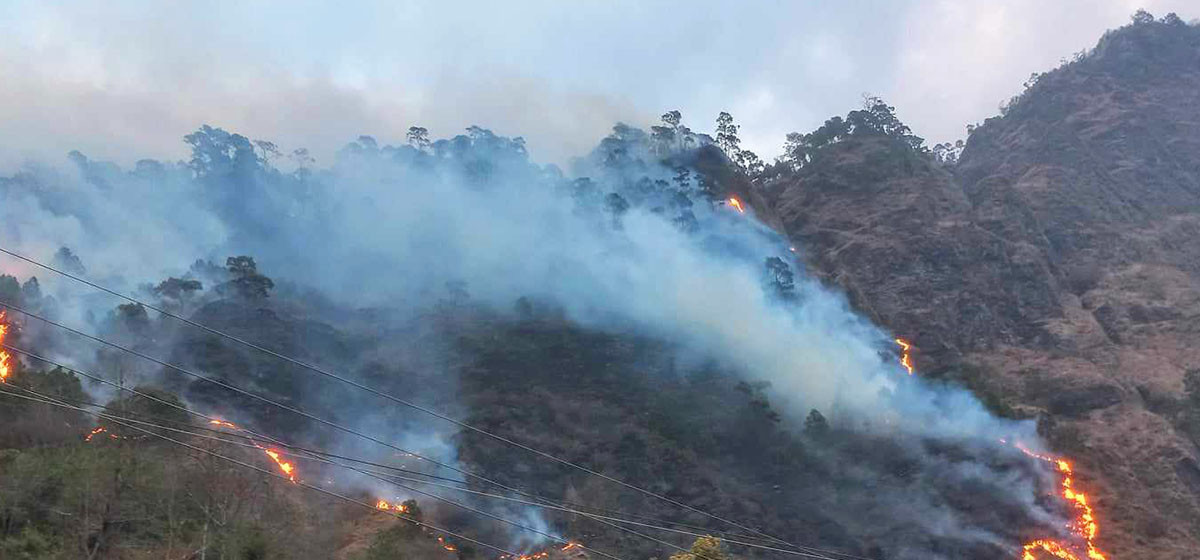
- 70 community and national forests affected by fire in Parbat till Wednesday
- NEPSE loses 3.24 points, while daily turnover inclines to Rs 2.36 billion
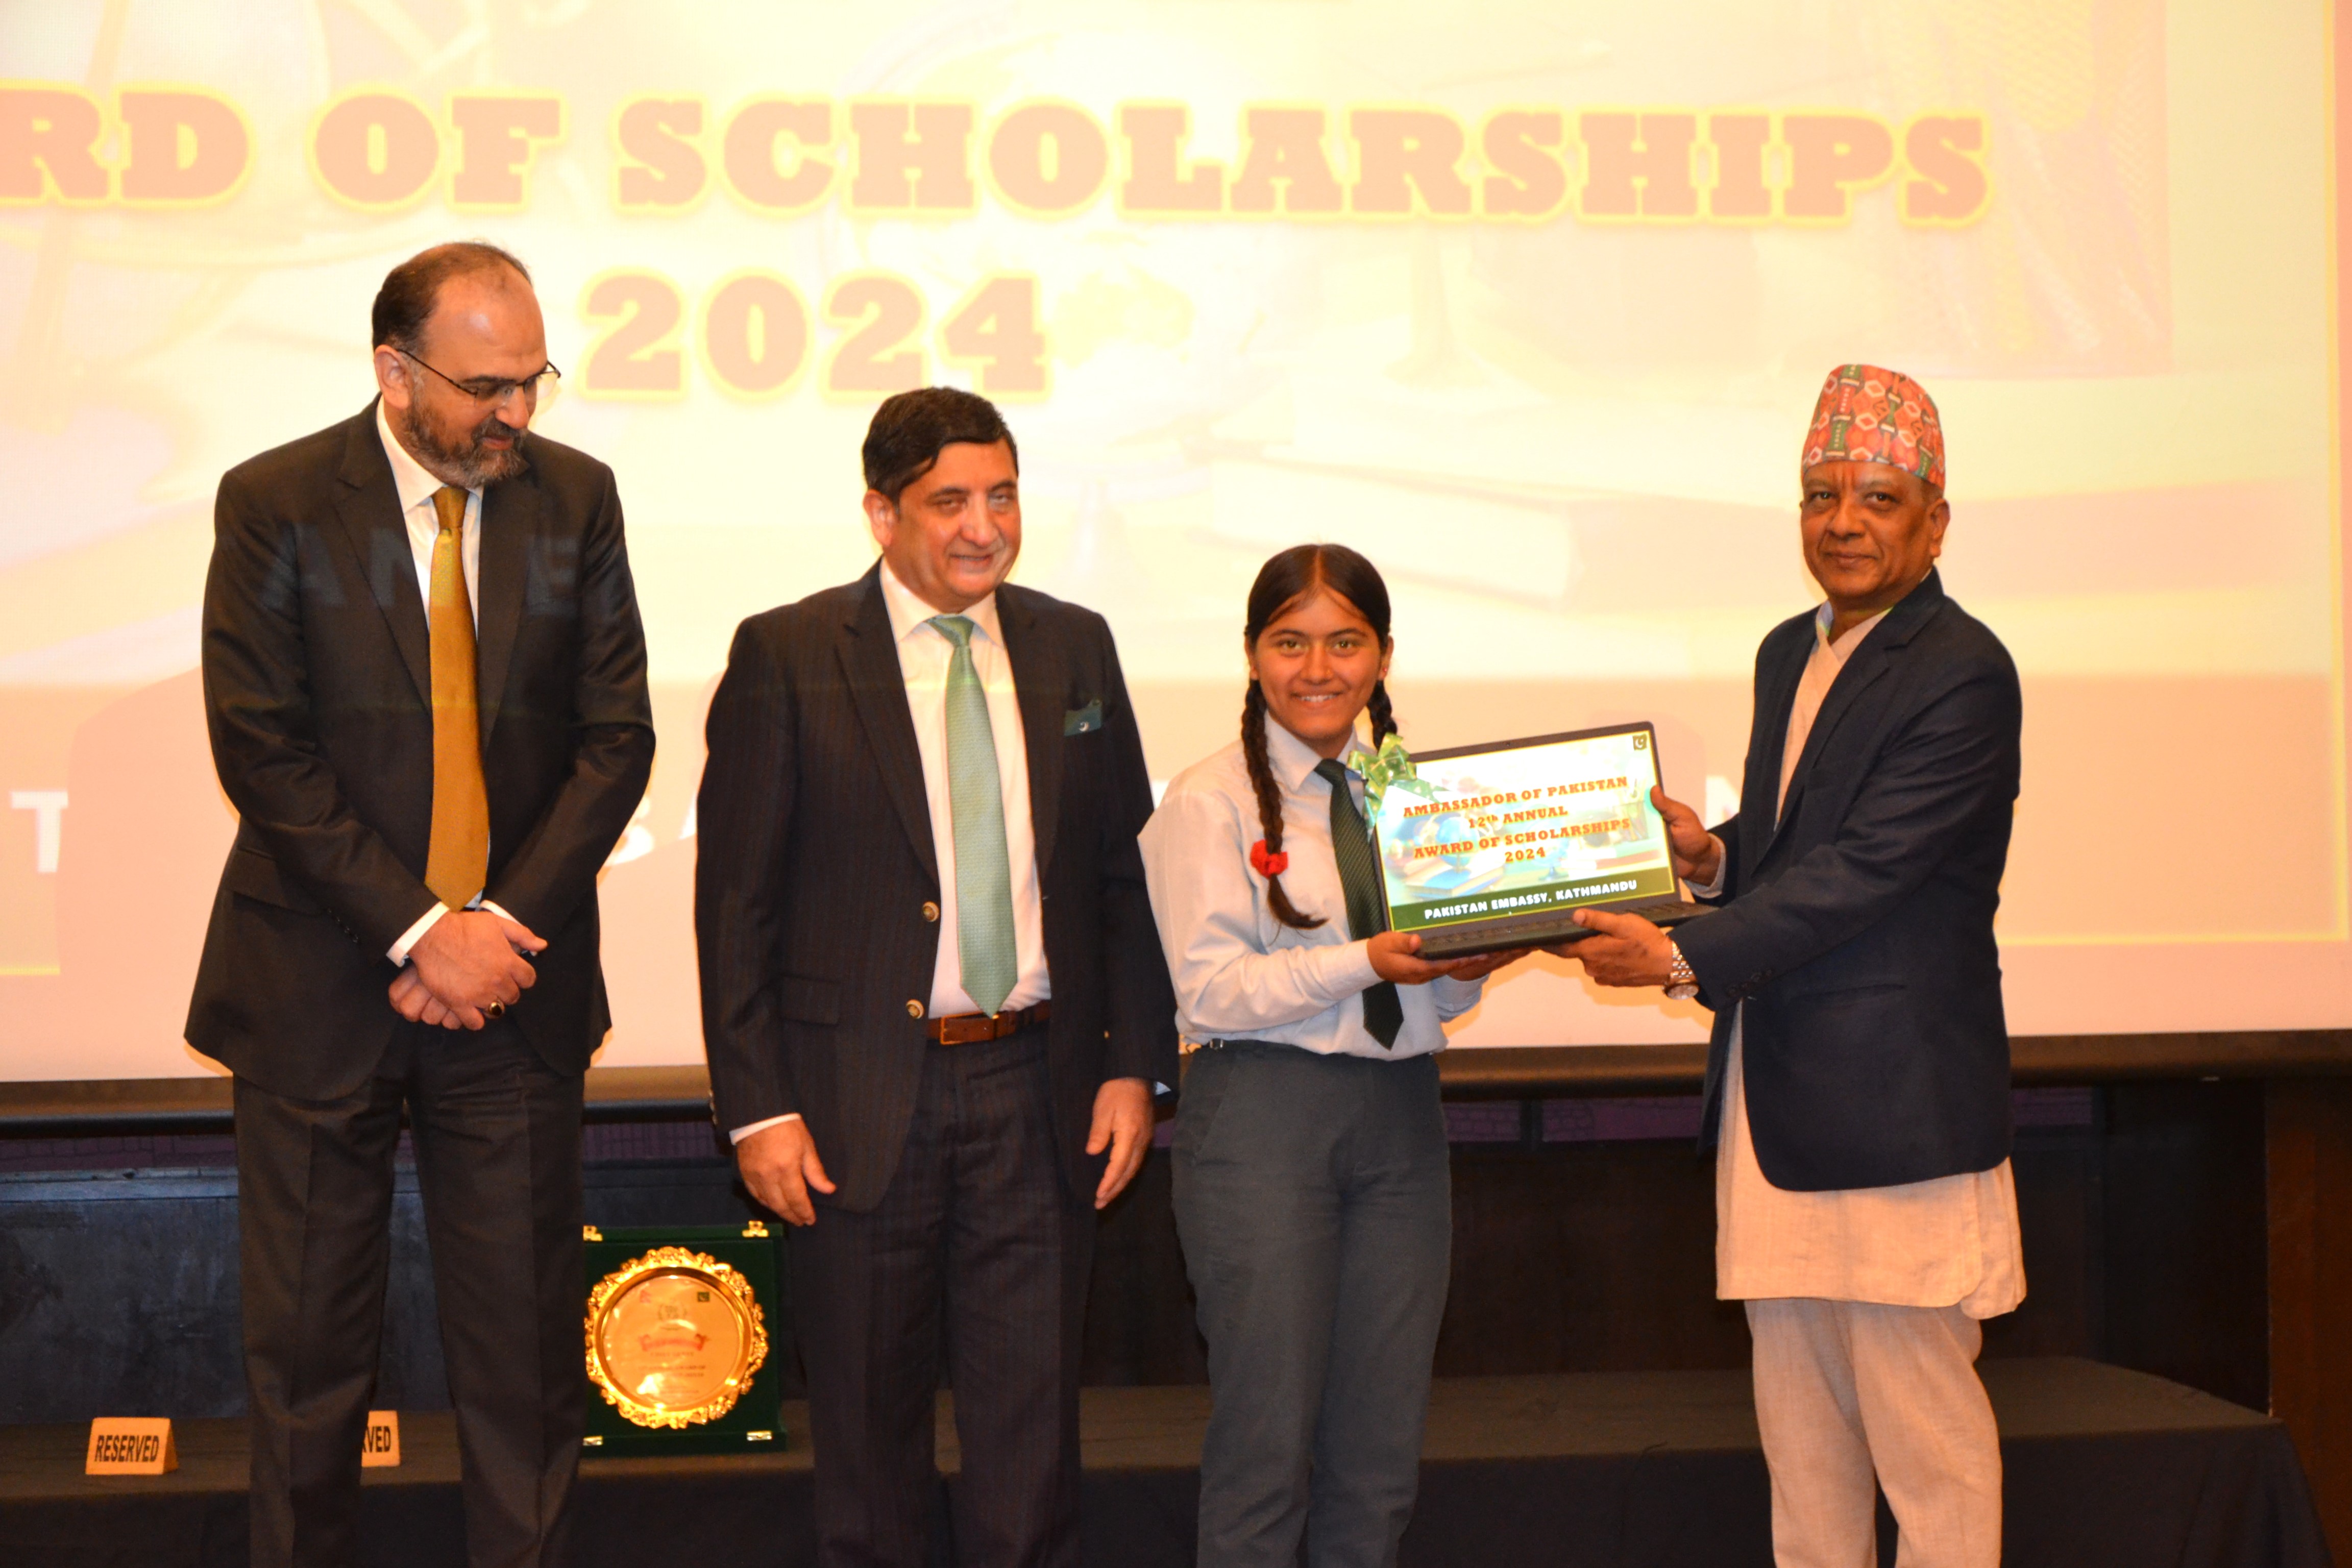
- Pak Embassy awards scholarships to 180 Nepali students
- President Paudel approves mobilization of army personnel for by-elections security
- Bhajang and Ilam by-elections: 69 polling stations classified as ‘highly sensitive’
- Karnali CM Kandel secures vote of confidence
Leave A Comment